Admin Panel
Monitor your platform's users, revenue, and analytics, and manage system settings from the admin panel.
Overview
The admin panel gives the operator of an installation platform-wide visibility and a small set of platform-wide controls. It is separate from a schedule owner's own admin portal: nothing here is scoped to one schedule. The navigation is one plain tab plus three dropdowns, and which items appear depends on how the install is configured.
| Menu | Pages | Availability |
|---|---|---|
| Dashboard | Key metrics, growth trends, and the Needs attention list | Every install |
| Insights | Users, Revenue, Analytics, Usage | Every install |
| Manage | Boost, Newsletters | Every install |
| Manage | Schedules, Domains, Referrals, Blog | Only when IS_HOSTED=true |
| System | Audit Log, Queue, Logs, Settings, Translations | Every install |
| System | Support | Only when IS_HOSTED=true |
| System | Federation (the moderation queue for other instances) | eventschedule.com only |
A Refresh button sits at the end of the navigation row. No admin page polls or auto-refreshes, so the numbers are always as of the last page load.
Date range
Six pages carry a date-range selector: the Dashboard, Users, Revenue, Analytics, Usage and Boost. The choices are fixed: Last 7 Days, Last 30 Days (the default), Last 90 Days and All Time. There is no custom start and end date. Where a page shows a change percentage, it compares against the immediately preceding window of the same length. All Time has no preceding window, so read its change figures as noise: with nothing to compare against, every one of them reports +100%.
The Audit Log has its own From and To date filter instead, and the remaining pages are not date filtered at all.
The counts across the Dashboard and Insights deliberately exclude demo data, users who never confirmed their email address, and schedules that verified neither an email address nor a phone number. A brand new install that has not verified anything therefore reports zero users and zero schedules even though rows exist in the database.
Accessing /admin
The admin panel lives at /admin, which redirects to /admin/dashboard. It is restricted to users whose is_admin column is set to true, and there is no screen for granting that: it is set in the database.
- Grant the flag by updating the
userstable directly (see the query below). - Make sure the account has a password. An account created through Google sign-in has none, and the panel will send you to your profile settings to set one first.
- Sign in and open
/admin, or use the Admin item that now appears at the bottom of the main sidebar. - Re-enter your password when prompted. This confirmation is required once per session, on top of being signed in.
UPDATE users SET is_admin = 1 WHERE email = '[email protected]';Session protections
- Password confirmation - stored per session, so a rejoined session asks again. Failed and successful confirmations are both recorded in the audit log.
- Browser binding - the confirmed session is tied to the browser that confirmed it. If the user agent changes, the confirmation is dropped, an
admin.session_changedentry is written, and you are asked to confirm again. - Rate limits - admin pages allow 30 requests per minute per user, and the password confirmation form allows 5 attempts per minute.
Only grant admin access to trusted people. Admins can see all platform data including user email addresses, revenue, and system logs, and can change settings that affect every public page. Admin actions are written to the audit log.
Dashboard
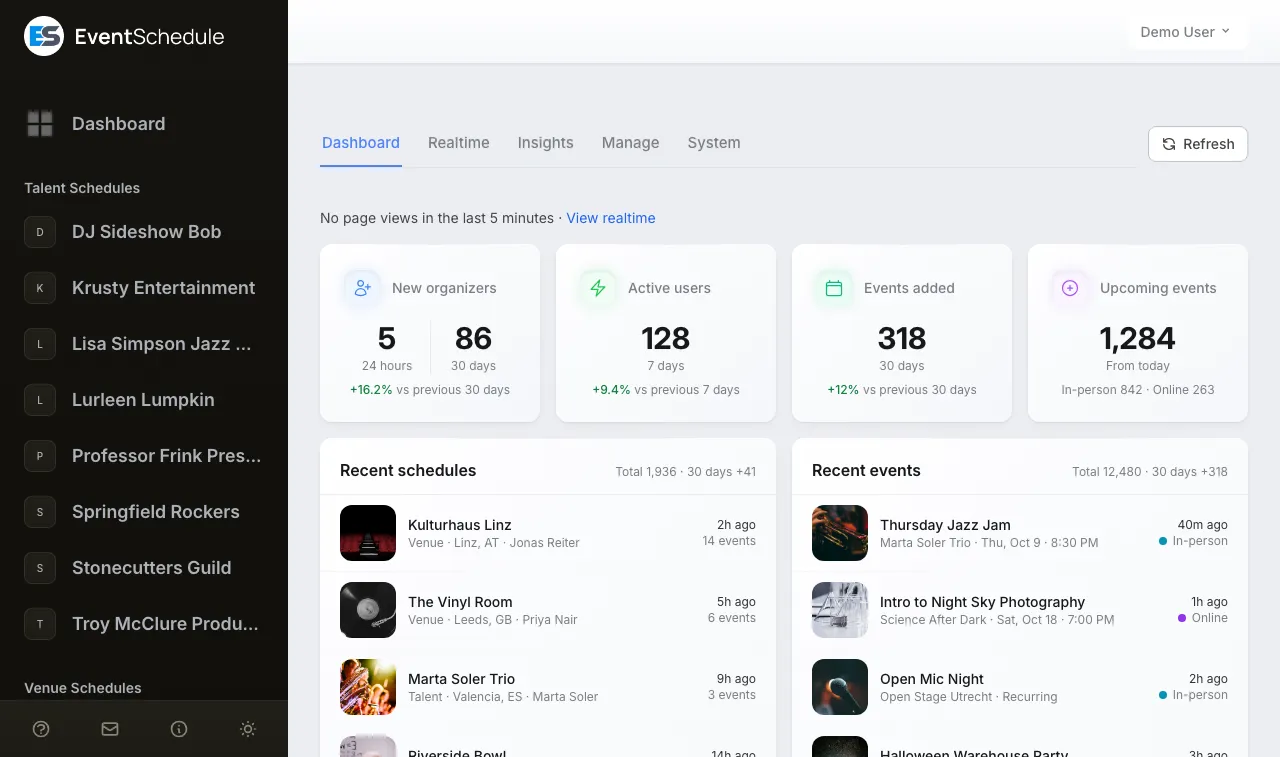
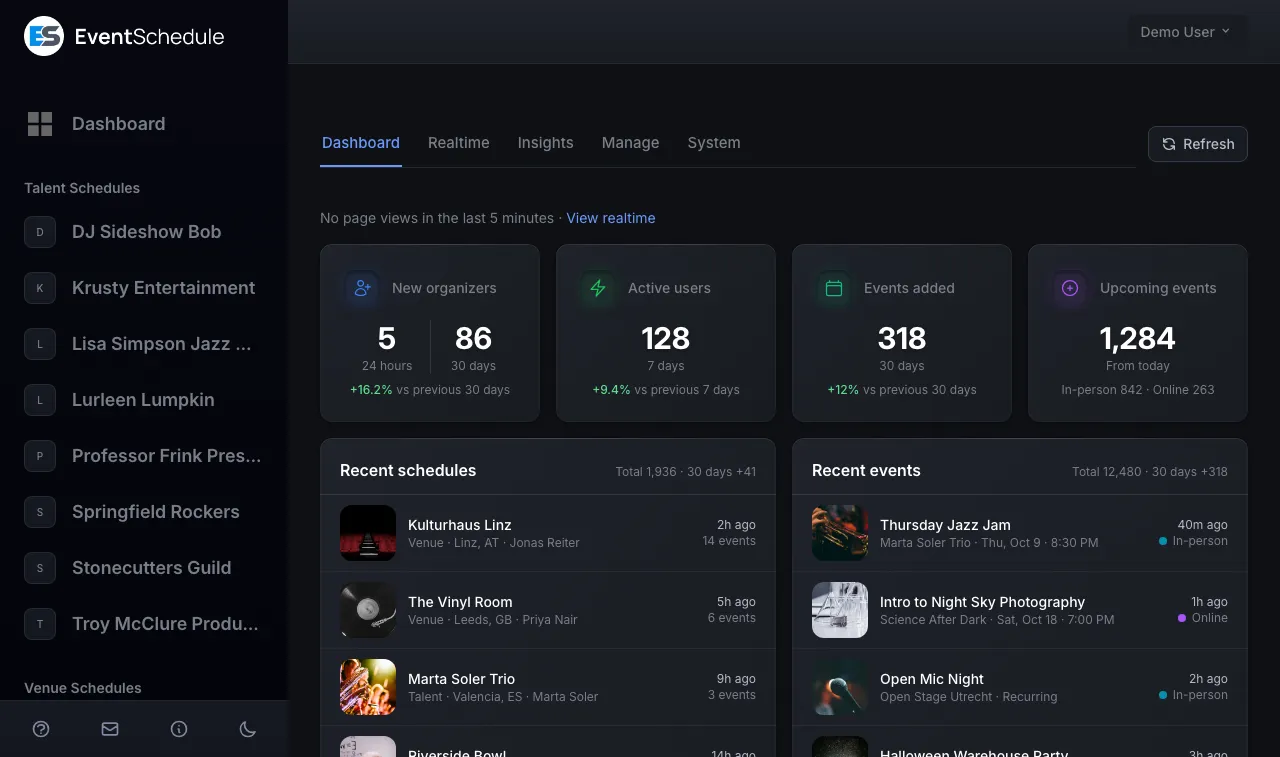
The dashboard is the landing page of the admin panel and is read-only. From top to bottom it shows:
- Needs attention - everything waiting on an admin, when there is anything (see below)
- Total users, schedules and events - each with the change against the previous period and how many were added inside the selected range
- Activity - active users in the last 7 and 30 days, upcoming online events, and private events with how many of those are password protected
- Money - schedules paying through Stripe, annual recurring revenue (the tile is labelled ARR), active boost campaigns, and boost markup revenue for the period
- Upcoming events by country - the top ten countries, taken from the venue's country, and hidden when no upcoming event has a venue country set
- Growth trends - users, schedules and events over the selected range, grouped by day, week or month depending on its length
- Recent signups - the ten newest accounts with the source they arrived from
- Recent schedules and recent events - the twenty newest of each; private events are left out of the event list
- Signups by method - email, Google, and hybrid (an account that has both a password and Google connected)
- Custom domains - every schedule with a custom domain, then how many direct-mode domains are active and how many are still pending
- Queue health - pending and failed job counts, with the failed figure turning red as soon as it is not zero. These are read-only tiles; use the Queue page to act on them.
Needs attention
Above the metrics sits a Needs attention panel that collects every queue in the admin panel that is waiting on a person into one list, each row linking straight to the page where you deal with it. It is only rendered when there is something in it, so a dashboard without it means nothing needs you.
Rows are listed in the order below: breakage and held-up money first, then review queues, then rows that are informational. A row with a count of zero is omitted, and a row whose page does not exist on this install can never appear.
| Row | What it means | Appears on |
|---|---|---|
| Failed jobs | Rows in the failed job table. Links to Queue. | Every install |
| Custom domains failed to provision | A domain whose provisioning ended in failure. Links to Domains. | Hosted |
| Campaigns stuck awaiting payment | A boost campaign that has sat unpaid for more than 30 minutes, which usually means the payment callback never arrived. | Every install |
| Failed campaigns | Boost campaigns that failed in the last 30 days. Nothing ever moves a campaign out of this state, so the window keeps the badge from becoming permanent. | Every install |
| Sales with an amount mismatch | A ticket sale where the amount actually paid does not match the amount expected. You approve or refund it on the Revenue page. | Every install |
| Campaigns with an amount mismatch | The same check on a boost campaign's charge. | Every install |
| Promotions awaiting review | A paid on-network promotion waiting for approval before it can serve. Links to the queue on the Boost page. | When the promotions network is enabled |
| Approved instances changed their address | A federated instance whose site address no longer matches what was approved. | eventschedule.com only |
| Instances awaiting approval | A federated instance that has registered and is waiting to be moderated. | eventschedule.com only |
| Translation suggestions to review | Wording shared by another installation, waiting for a decision. | eventschedule.com only |
| Unread support messages | Support chat messages from customers that no admin has read. | Hosted |
| Campaigns with disapproved ads | An ad that Meta rejected, within the last 30 days. | Every install |
| Custom domains still provisioning | A domain that is pending, usually waiting on DNS or a certificate. | Hosted |
| Translations not shared yet | Your own translation edits that have not been offered back to the community. | Every install except eventschedule.com |
| Unverified schedules | A claimed schedule that has verified neither an email address nor a phone number. | Hosted |
| Referrals not converted yet | A referral whose invited user has not subscribed. | Hosted |
The same counts drive the badges on the Insights, Manage and System menus and on the items inside them. A group's badge takes the colour of the most serious row it contains, so a failed queue is not softened by sitting next to a routine unverified schedule. Each count reuses the query the destination page runs, so a badge and the page it links to cannot disagree.
Only rows that can apply to your install are counted. With IS_HOSTED=false the domain, support, unverified-schedule and referral rows always read zero, and the federation and translation-review rows only ever appear on eventschedule.com itself.
Users (Insights)
The Users page is an aggregate report about how people arrive and whether they get their first event published. It is not a user directory: there is no search box, no per-user row to open, and no way to edit an account from here. Only confirmed accounts are counted, and the demo account is excluded.
- Onboarding funnel - visited the site, viewed the sign-up page, created an account, reached the schedule step, saved a schedule, reached the event step, saved an event. Highlighted above it are the signup-to-first-event rate with its change against the previous period, the biggest single drop between stages, and the visitor-to-first-event rate.
- Funnel over time - the same conversion rates per day, week or month. The most recent period is marked as still in progress, because its accounts have not had time to finish onboarding.
- Totals - total users, active users in the last 7 and 30 days, and newsletter subscribers with the number who unsubscribed.
- Signup method - email, Google, and hybrid, both all time and for the selected period.
- Attribution - top UTM sources for the period, top campaigns and sources all time, top referring domains, and how many signups arrived with no UTM data at all.
- Onboarding progress - recent accounts with how far each one got.
- Recent signups - twenty per page, with the sign-up intent, every UTM field, the referrer and the landing page.


The two anonymous stages come from marketing-site traffic, which is only recorded on eventschedule.com. On any other installation the funnel notes that site traffic is not tracked and starts at "Created account", and the visitor-to-first-event rate is left empty.
To act on a single account or schedule, use Manage > Schedules, which is where the search, filters, plan editing and manual verification live.
Revenue (Insights)
The Revenue page reports on ticket sales across every schedule, plus subscription health where the install sells plans. Amounts are the payment amounts recorded on each sale.
- Total revenue and total sales - all time, each with the figure for the selected period underneath
- Refund rate - refunded sales as a share of paid plus refunded, turning red above 5 percent
- Pending revenue - the value of the sales still marked unpaid, with how many there are
- Boost markup revenue - your all-time margin on boost spend, with the figure for the period underneath. This tile sums charges only; the equivalent figure on the Boost page is net of refunds, so the two do not have to match.
- Subscription health - active, trialing, canceled and past-due subscriptions, schedules on trial, how many converted, and expired trials with no subscription. This whole panel is only rendered when
IS_HOSTED=true. - Revenue trend - a chart over the selected range
- Recent sales - the fifty most recent, excluding demo schedules


Amount mismatches
When the amount a payment provider reports does not match the amount the sale expected, the sale is parked as a mismatch rather than being treated as paid. Those sales, and any boost campaign in the same state, are listed in an amber panel on this page, which is only rendered when something is in it, with two actions each:
- Approve - accept it and mark it paid
- Refund - return the money through Stripe
Both actions are recorded in the audit log, and the row disappears from Needs attention once the queue is empty.
Analytics (Insights)
The Analytics page rolls up the same daily page-view data that each schedule sees on its own Analytics tab, across every non-demo schedule.
- Device breakdown - total page views for the period split into desktop, mobile and tablet. Views whose device could not be determined are counted in the total only.
- Traffic sources - direct, search, social, email, newsletter and other
- Feature adoption - six bars showing how many verified schedules use Google Calendar sync, sell through Stripe, have a custom domain, use custom CSS, have sent a newsletter, or have run a boost campaign, each as a count and a share of every verified non-demo schedule. The Stripe Payments bar counts schedules with an event actually priced in Stripe, not schedules that merely connected an account.
- Stripe funnel - the three stages that bar skips past: connected an account, finished onboarding, and priced an event in Stripe
- Top schedules by events - the ten schedules with the most events


Page views are counted per day and per device, not per visitor, so there is no unique-visitor figure and no per-visitor location. The nearest thing to a geographic view is Upcoming events by country on the dashboard, which is based on the venue's country rather than the visitor's.
Usage (Insights)
The Usage page counts calls to the services your install depends on, so you can see what is consuming your API quotas and mail allowance. Every operation is tallied per day and per schedule as it happens.
Seven categories are summarised, each with today's total, the total for the selected period, the average per day, and the configured daily limit:
- Emails, AI / Gemini, Google Calendar, Stripe, Invoice Ninja, CalDAV and YouTube
The daily limits come from config/usage.php and its environment variables, not from this page. YouTube has no limit. When today's total for a category passes its limit, a red anomaly banner appears at the top of the page.
Below the summaries:
- Operation breakdown - every individual operation, with today, the period total and the daily average
- Top schedules by usage - the twenty heaviest schedules, split by category
- Top newsletter senders - who is sending the most newsletter email, with their plan and whether they send through their own SMTP server rather than yours
- Stuck translation records - up to twenty each of the schedules, events, event parts and event listings that have been attempted at least three times (the threshold is
USAGE_STUCK_THRESHOLD) and still have no translation. Each row has a Retry link that clears the attempt counter so the next scheduled run picks it up again.


This page measures external calls made in a window. How many schedules have turned on a feature is on the Analytics page instead.
Boost (Manage)
The Boost page is where you oversee every paid promotion bought on the platform, whether it runs as a Meta ad or as a promotion served on your own pages.
- Summary - total and active campaigns, markup revenue net of refunds, ad spend that left for Meta, refunds, and average click-through rate, cost per click and cost per thousand impressions
- Rejection rate - rejected campaigns as a share of those with a settled outcome, turning red above 20 percent
- Promotions awaiting review - up to fifty paid on-network promotions, oldest first, each showing the creative, the schedule, the buyer, the budget and the pricing model, with Approve and Reject on each and an optional reason to send with a rejection. Rejecting refunds the advertiser in full, back to their boost credit if that is how they paid and through Stripe otherwise, and emails and pushes the outcome to them. This panel only appears when the promotions network is enabled and something is waiting.
- Alerts - campaigns stuck awaiting payment, campaigns that failed, and ads Meta disapproved, in one red panel
- Status distribution and top boosters - the ten schedules with the largest total budget
- Revenue trend - ad spend against markup over the selected range
Granting credit and capping budgets
Below the revenue trend, two forms act on a single schedule, identified by its subdomain (the field autocompletes as you type):
- Grant Boost Credit - add up to 1,000 in boost credit to a schedule, which it spends before its card is charged. Schedules holding a balance are listed underneath.
- Set Spending Limit - raise or lower the maximum budget that schedule may put on a single campaign. Schedules with a custom limit are listed underneath; when none has one, the panel names the default that applies to everyone else instead.
Both are written to the audit log. Two tables close the page:
- Campaigns - twenty per page, newest first, with the campaign name, buyer, event, schedule, status, budget, spend, impressions, clicks and creation date. A single dropdown filters by status: active, paused, completed, cancelled, failed, pending payment or rejected.
- Recent Billing Records - the thirty most recent charges and refunds behind those numbers, each with its amount, markup, status and notes
The page is always in the menu, but Meta campaigns can only exist once the Meta app, ad account and access token are configured. See the Boost Setup guide. On-network promotions are configured separately, in the Monetization card on the Settings page.


Schedules and plans (Manage)
This is the Schedules item in the Manage menu, at /admin/schedules; the older /admin/plans address redirects to it. It is the one place in the admin panel where you change something about an individual schedule.
- Plan counts - how many verified, non-demo schedules resolve to Free, Pro and Enterprise, plus how many pay through Stripe, how many were granted a plan by hand, how many are on trial, and how many expire in the next 30 days
- Search - by schedule name, subdomain or email address
- Filters - plan type, status (active, expired or trial), source (Stripe, manual or trial) and verification (verified or unverified)
- Listing - twenty schedules per page, newest first. Demo schedules are left out, but unverified ones are listed even though the counts above exclude them.
Editing one schedule
Opening a schedule shows a read-only Current Subscription Status panel (status, Stripe customer, trial end and whether a subscription is active) and gives you three actions, and nothing else:
- Assign a plan - set Plan Type to Free, Pro or Enterprise, set Plan Term to monthly or yearly, and set Plan Expires. The expiry field has +30 days, +90 days, +1 year and Clear shortcuts. A paid plan granted this way is tagged as an admin grant, which is what keeps the small Event Schedule credit on that schedule's public pages. Setting it back to Free, or editing a schedule that pays through Stripe, clears that tag.
- Mark Email as Verified - mark the schedule's email address as verified without the owner clicking the link.
- Mark Phone as Verified - the same for a phone number.
All three are recorded in the audit log with the values before and after.
This page only exists when IS_HOSTED=true. A selfhosted install resolves every schedule to the Enterprise feature set, so there is no plan to assign and nothing to gate. Prices, terms and the features in each tier come from your Stripe configuration and the application itself; they cannot be edited from the admin panel.
Domains (Manage)
The Domains page lists every schedule that has connected a custom domain, in either mode: Direct, where the domain serves the schedule itself, or Redirect, where it forwards to the subdomain.
- Totals - all custom domains, how many are direct, and how many of those are active or pending
- Search and filters - by schedule, subdomain, domain or hostname, and by mode and status (pending, active or failed)
- Status columns - the status Event Schedule recorded, alongside the live status read back from DigitalOcean when the DigitalOcean API is configured
- Listing - twenty domains per page, newest first
Actions
- Re-provision - removes the hostname from the hosting platform and adds it again, which restarts certificate issuing, and returns the domain to Pending. Direct-mode domains only, and only when the DigitalOcean API is configured.
- Remove - clears the domain from the schedule and, for a direct-mode domain, removes the hostname from the hosting platform. The schedule falls back to its subdomain.
Certificates themselves are issued by the hosting platform, not by Event Schedule. If a domain stays pending, the usual cause is DNS that does not yet point at your install.
This page only exists when IS_HOSTED=true. A single-tenant selfhosted install is already served from your own domain and has nothing to map.
Newsletters (Manage)
These are platform newsletters to the people who have registered on your install, which is a different thing from the newsletters a schedule owner sends to their own followers. Only admins can create them, and they never go to a schedule's followers.
Composing and sending
- Create - start from scratch or from a saved template, give it a subject, and build the body from ten block types: heading, text, button, image, video, divider, spacer, social links, quote and offer.
- Style it - pick one of five layouts (Modern, Classic, Minimal, Bold or Compact) and set the background, accent and text colours, the font, the button shape and the footer text.
- Choose the audience - select one or more segments. The recipient count for each is shown as you pick. Leave the selection empty and the newsletter goes to every confirmed account that has not opted out.
- Check it - preview the rendered email, and send a test to yourself.
- Send or schedule - send immediately, or schedule it for a future time in your own timezone. A scheduled newsletter can be cancelled while it is still waiting, which returns it to draft.
A schedule owner's newsletter builder has extra blocks that pull from their schedule: events, profile image, header banner, sponsors and a poll. A platform newsletter has no schedule behind it, so those blocks are not offered. The offer block is the reverse case: it is offered here and not to schedule owners.
A sent newsletter can be cloned into a new draft, and any newsletter can be saved as a reusable template from the Templates button on the listing. The listing shows each one's subject, status, how many were sent, its open and click rates and when it was created; opening a sent newsletter shows the full statistics.
Segments
Segments are managed from the Segments button on the newsletter listing. Five kinds are available:
- All Platform Users - every confirmed account
- Plan Tier - the owners and admins of schedules on Free, Pro or Enterprise
- Signup Date - accounts created between two dates
- Admins - other admins, useful for testing
- Manual - a list you add people to by hand
Only the name of an existing segment can be edited; to change what a segment matches, create a new one. Every send drops anyone who has unsubscribed from platform newsletters or turned email off entirely, whichever segment produced them, so an opt-out is honoured even from a manual list. A segment cannot be deleted while a draft or scheduled newsletter still uses it.


With the default QUEUE_CONNECTION=sync the send runs inside the web request, so sending to more than 50 recipients is refused and you are asked to schedule it instead. Scheduled sends are picked up by the cron entry every minute. To send large newsletters immediately, switch to a real queue connection and keep php artisan queue:work running.
Blog (Manage)
The Blog section publishes posts to your public blog, with an RSS feed. Each post has:
- A title, a Markdown body, and an optional short excerpt
- Comma-separated tags
- A published state and a publish date, so a post can be written ahead of time
- A meta title and meta description for search results
- A header image chosen from the set that ships with the application
- An author name
If AI is configured, a Generate action drafts a post from a topic you type in, which you then edit before publishing. See AI Setup for the API key it needs.
The Blog item only appears when IS_HOSTED=true. A selfhosted install still serves the public blog routes at /blog and /blog/feed, but has no screen for writing posts, so they stay empty.
Audit Log (System)
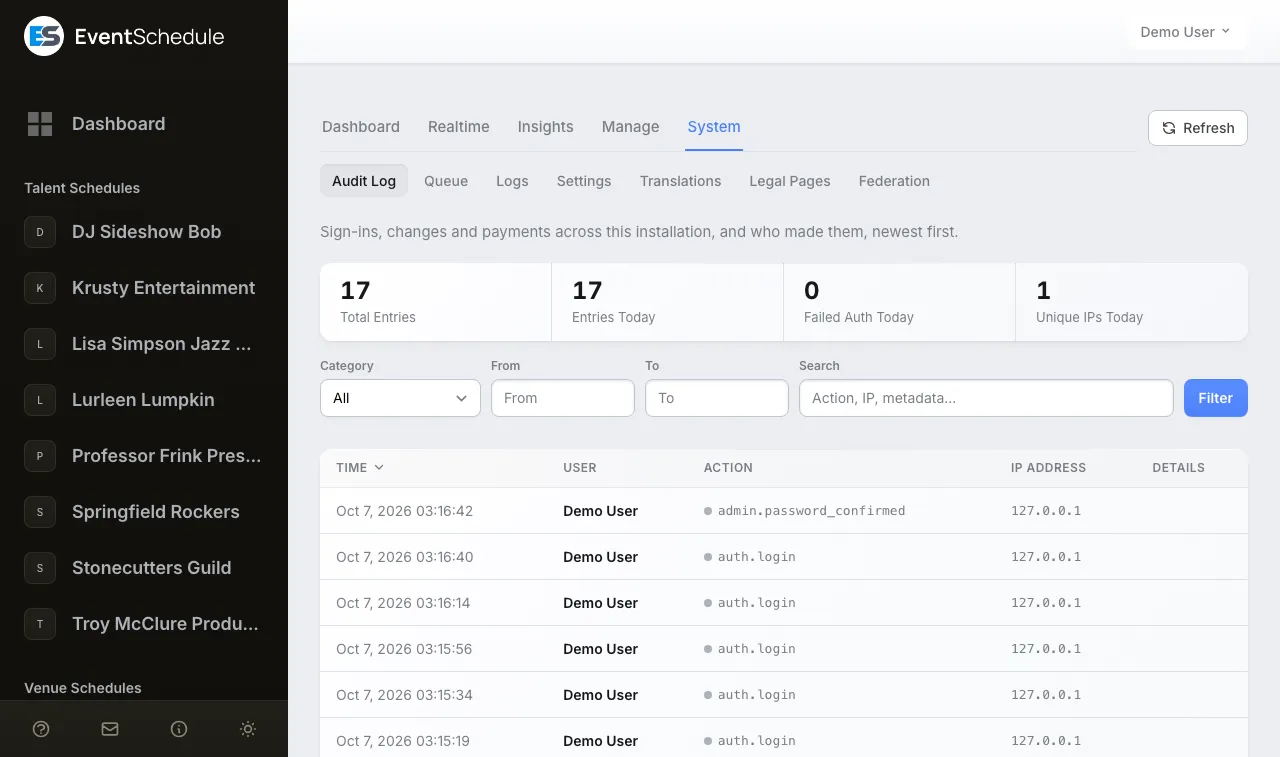
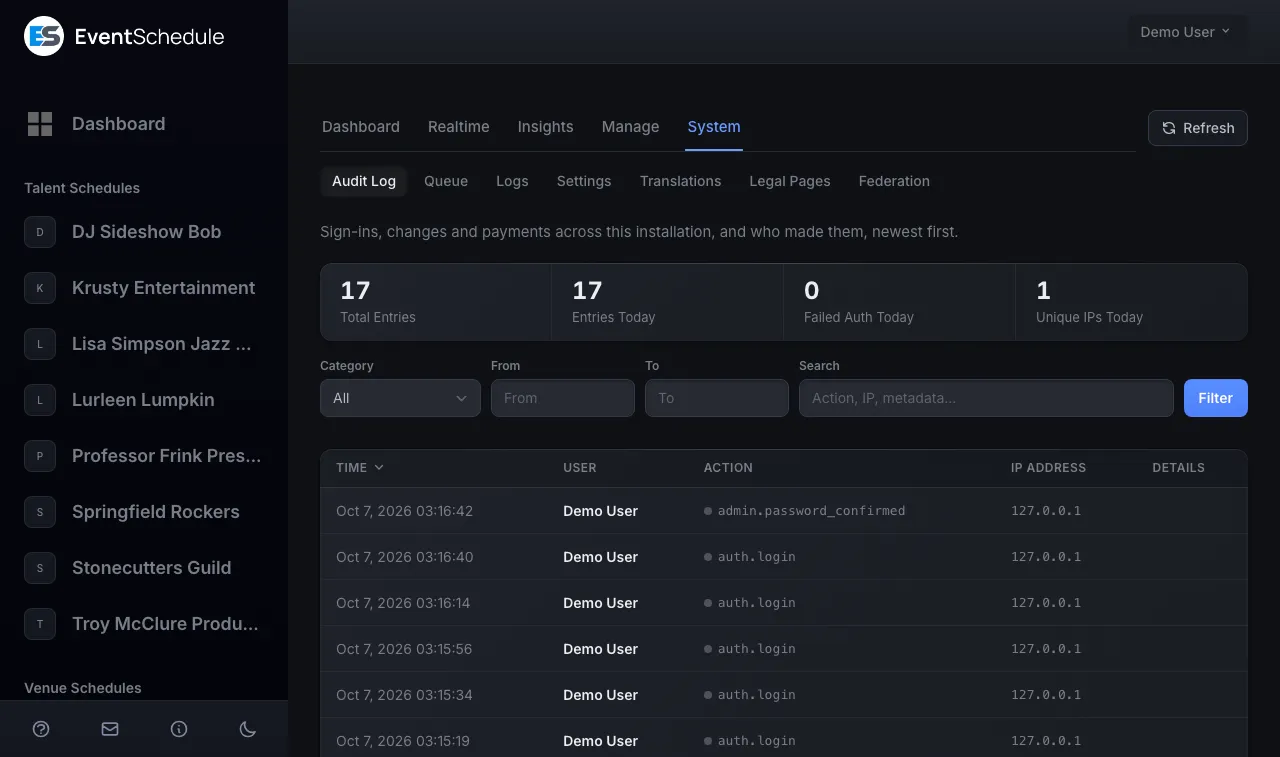
The Audit Log is a chronological record of security-relevant and administrative actions. Each entry stores the time, the user, the action, the IP address, and a details field holding the values before and after the change.
- Summary - total entries, entries today, failed sign-in attempts today, and how many distinct IP addresses were seen today
- Filter by category - admin, api, auth, boost, event, google_calendar, profile, sale, schedule, stripe, subscription and webhook
- Filter by date - a From and To range
- Search - matches the action name, the details and the IP address
- Sort - by time, user, action, IP address or details, in either direction
- Listing - fifty entries per page
A daily scheduled task deletes audit entries older than 90 days, so the table cannot grow without bound. If you need to keep them longer, export or replicate them yourself; the retention is set by the pruning command, not by a setting on this page.
Queue (System)
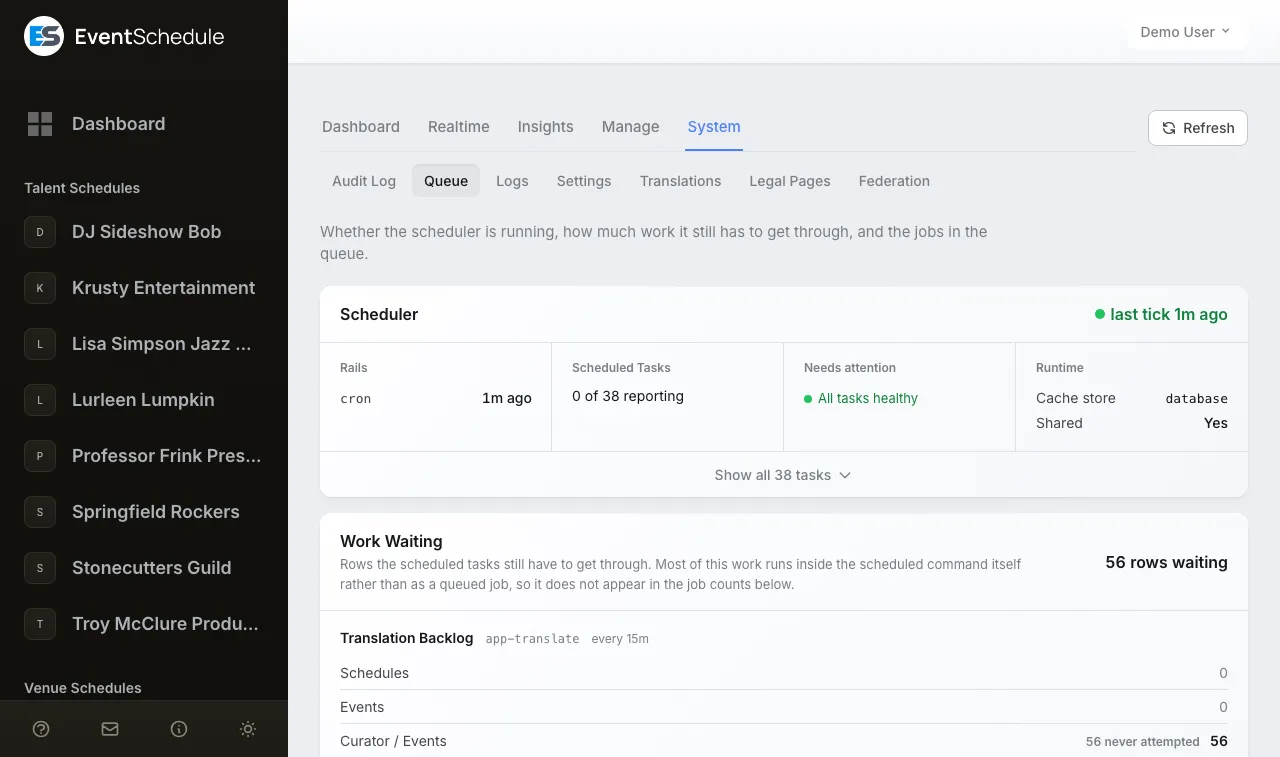
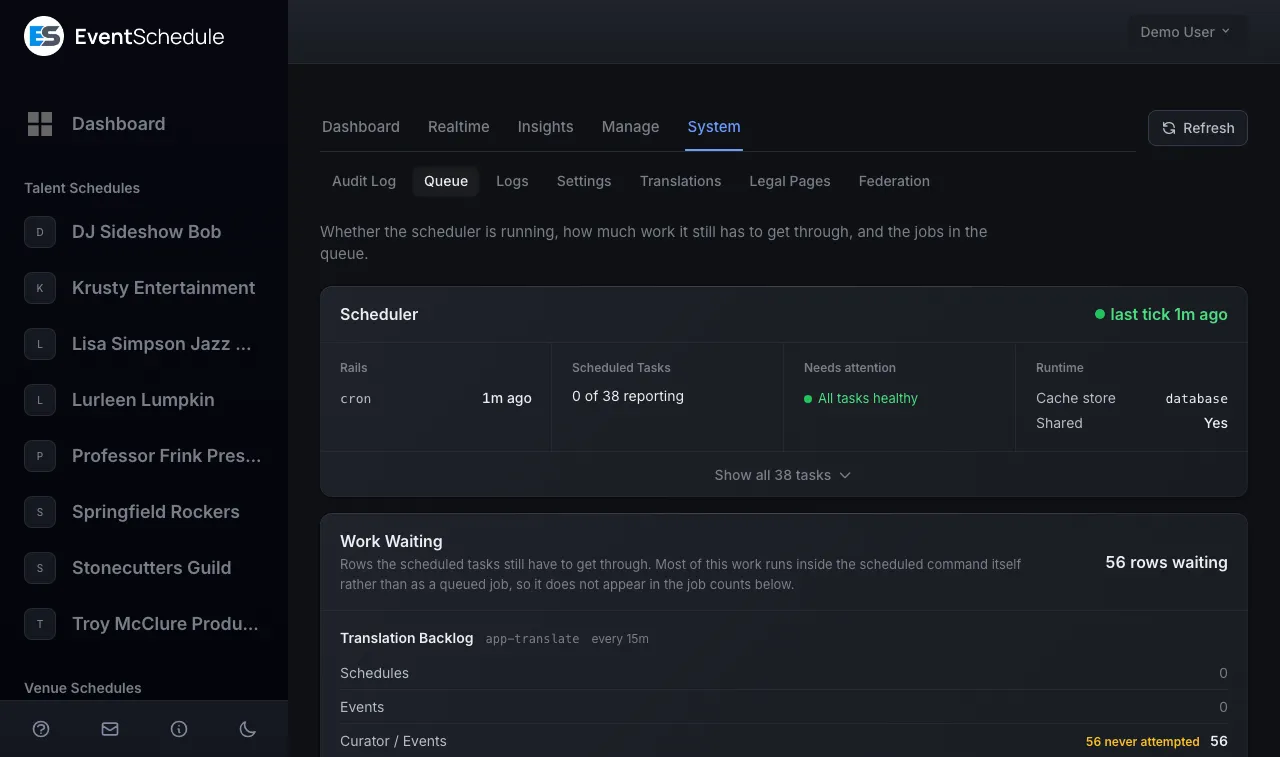
The Queue page reports on background jobs: calendar syncs, newsletter batches, graphics generation and anything else the application defers.
- Health cards - pending jobs (with a per-queue breakdown underneath the number), failed jobs, job batches, and the age of the oldest pending job
- Warning banner - shown when anything has failed, or when the oldest pending job has waited more than an hour, which normally means no worker is running
- Pending Jobs by Class - which job type is backing up
- Failed jobs - the hundred most recent, each with its class, queue, failure time and exception; retry or delete them individually
- Pending jobs - the hundred most recent, with attempt count and when each becomes available
- Job batches - the fifty most recent, with progress and failure counts
Three bulk actions sit above the tables, each behind a confirmation prompt. They are only rendered when they have something to act on:
- Retry All Failed and Clear All Failed - shown only while there is at least one failed job
- Flush Pending - shown only while there is at least one pending job. It truncates the job table, so the work is discarded permanently; use it only to clear a backlog you know is stale.
Failed jobs are also retried automatically: the cron entry pushes them back onto the queue for you, so a job that failed because of a passing problem (an unreachable mail server, a rate-limited API) usually recovers without anyone touching this page. Each job gets five automatic retries spaced fifteen minutes apart. After that it is left alone rather than retried forever, so a job that can never succeed stops consuming a worker on every cron run - it simply stays in the table with the exception that explains it.
Nothing is set aside permanently. The count resets after a day, so a job left over from a long outage is picked up again tomorrow, and pressing Retry clears it immediately - which is what to do once you have fixed whatever the exception was pointing at. A job whose exception says it refers to a record that no longer exists cannot be retried at all, because the record it needs is gone; delete it.
Queued jobs are run by a worker process (php artisan queue:work), which is separate from the cron entry that runs scheduled commands. With the default QUEUE_CONNECTION=sync nothing is queued at all: work happens inside the web request and this page stays empty, which is normal for a small install.
Logs (System)
The Logs page reads the application log at storage/logs/laravel.log so you can diagnose problems without shell access. It parses only the last 5 MB of the file, which keeps a very large log from exhausting memory but also means older entries are not shown.
- Level counts - how many entries there are at each severity: emergency, alert, critical, error, warning, notice, info and debug
- Repeated errors - entries at error level and above, grouped by their message with the variable parts collapsed, showing the number of occurrences and when it was first and last seen. A message only appears once it has been logged at least twice, so this is usually the fastest way to find the one thing going wrong repeatedly.
- Filter and search - narrow to a single level, and search the message text and the stack trace
- Entries - up to 200 shown at a time, newest first, each expandable to its full stack trace
- Download - fetch the whole log file, and Clear to empty it after you have finished with it


Stack traces and log messages may include email addresses and request details. Treat a downloaded log file as sensitive, and remember that clearing the file cannot be undone.
Settings (System)
The Settings page holds the handful of settings that apply to the whole installation. It is built from separate cards, each with its own Save button, and a card is only rendered when it can do something on this install. Two of the four are gated on an .env switch, so a plain selfhost usually sees the first two. None of these settings can be changed while the install is in demo mode.
| Card | What it does | When it appears |
|---|---|---|
| Header / Footer Code | Injects your own code into every public guest page | Always |
| Event Schedule network | Shares your public events with the eventschedule.com listings | Every install except eventschedule.com |
| Monetization | Google AdSense and the on-network promotions marketplace | ADS_ENABLED=true on a multi-tenant hosted install |
| Accommodation affiliate | A fallback affiliate ID for the nearby-lodging map | STAY22_ENABLED=true |
Header and footer code
This is where site-wide tracking such as Google Tag Manager or Google Analytics goes.
- Header Code - injected into the
<head>of public pages. Best for tag managers and analytics loaders. - Footer Code - injected just before the closing
</body>tag. Best for deferred scripts, chat widgets, and the Google Tag Manager<noscript>snippet.
The code is applied to public schedule, event and ticket pages. It is never added to the admin portal or to the marketing site. Script tags you paste are given the request's security nonce automatically, so they are allowed to run.
Header and footer code runs on every public page exactly as entered. Only paste code from sources you trust. Access to this page is restricted to admin users, and every save is written to the audit log.
Google Tag Manager and Google Analytics are permitted by the built-in Content Security Policy and work out of the box. Scripts that load from other external domains may be blocked - add the domain to the script-src directive in app/Http/Middleware/SecurityHeaders.php if needed.
Injected analytics are not automatically gated by the cookie-consent banner. You are responsible for configuring consent (for example, Google consent mode) to comply with the privacy regulations in your region.
Cookie consent banner
The banner appears only when something on the page actually needs consent: Google Analytics (ANALYTICS_ID), advertising (ADS_ENABLED) or the accommodation map (STAY22_ENABLED). A plain install that has none of those shows no banner at all, and sets no cookie that is not needed to make the site work.
That includes the three attribution cookies, utm_params, utm_referrer_url and utm_landing_page, which remember for 30 days which campaign or referring site brought a visitor in, so a later signup or ticket sale can be credited to it. They are written only after a visitor clicks Allow. Without the banner they are never written, and attribution lasts for the current session only, which is enough for a visitor who buys on the same visit.
Set COOKIE_CONSENT_BANNER=true in .env to show the banner regardless, which is what you want if you run marketing campaigns and need attribution to survive across visits.
The built-in analytics store daily totals only: views per device type, referrer, country and campaign tag. There is no per-visitor record. IP address and user-agent are hashed with your APP_KEY and a salt that rotates daily, purely to deduplicate and filter bots, and that hash lives in the cache until midnight rather than in the database. Nothing is read from or written to the visitor's device, so no banner is required for it.
Event Schedule network
One toggle opts your installation into sharing its public events with the eventschedule.com listings, and a contact email lets the moderators reach you. The card also shows the connection state (not connected, pending review, approved or suspended), when the last sync ran, and a preview of exactly which events would be sent, so nothing leaves your install unseen. Two counts under the preview explain why it may be shorter than you expect: schedules that have not verified an email address or phone number, and schedules that have not yet decided whether to take part. Turning the toggle off withdraws the listings again. See Federation for the full picture.
Monetization
This card configures advertising on free schedules: whether to show AdSense, the publisher and ad slot IDs, whether personalized ads are allowed, whether to run your own promotions marketplace, whether promotions take priority over AdSense, and the prices you charge per thousand impressions and per click. It stays hidden unless ADS_ENABLED=true and the install is a multi-tenant hosted platform, because a selfhosted install resolves every schedule to Enterprise and so has no free tier for an ad to appear on.
Accommodation affiliate
Setting STAY22_ENABLED=true lets schedules show a map of lodging near their venues and earn affiliate commission. The card holds a single field, the Fallback Stay22 affiliate ID, used only for schedules that enabled the map without supplying an ID of their own, and never on a schedule's own custom domain. See Accommodation affiliate for the disclosure obligations it places on you.
The Content Security Policy is rebuilt from STAY22_ENABLED on every request, so it can only be set in .env and never from the admin panel. If you cache your configuration, re-run php artisan config:cache after changing it, or the affiliate ID will save while the map stays blocked.
Translations (System)
The Translations page lets you review and customize every piece of text the app shows, in any of the supported languages. Fix an awkward translation, adapt wording to your industry (for example rename "ticket" to "registration" or "booking"), or fill in missing translations - all without editing any files.
- Pick a language and file -
messagesholds the app's UI strings;accessibilityandmarketingare smaller companion files. English is editable too, which is handy for renaming built-in terms. - Search and filter - find strings by key or text, and filter to only your customized keys or to translations that are missing in the selected language.
- Edit and save - type your text next to the original and save. Changes apply immediately, are stored in the database, and survive app updates. A per-row revert restores the shipped translation at any time, and clearing a field is the same as reverting it.
- Copy as PHP - copies your customizations as ready-to-paste language-file lines, useful for moving them into another install or contributing a pull request.
Some strings contain placeholders such as :name or plural forms separated by |. Keep them in your version so dynamic values keep working - the editor warns you if one goes missing, but never blocks the save.
Sharing improvements with the community
Many translation fixes are useful to every Event Schedule install. You can share yours with the community for review, and approved suggestions ship with future releases. Nothing is ever sent automatically: use the Share button to pick exactly which changes to send, or enable the auto-share toggle if you want saved changes submitted on their own. Keep auto-share off if your wording is specific to your business. Unshared changes are also counted on the dashboard's Needs attention list, so nothing sits forgotten.
Sharing sends the language, the file, the translation key, your suggested text and the shipped text it replaces, plus your app version and a random anonymous install identifier, to eventschedule.com. No URLs, email addresses, or other personal data are included.
Customizations are stored in the database and published as override files under storage/app/lang, or wherever LANG_OVERRIDES_PATH points if you run several servers from a shared volume. Hand-made override files (the pre-existing custom translations approach) are adopted into the editor automatically. After restoring a database backup or cloning to a new server, run php artisan translations:publish to rebuild the files.